Preliminary data on the effects of imidacloprid in sugar syrup on bumble bee foraging
Video below shows bees foraging on 0 ppb imidacloprid.
Above 0 ppb imidacloprid, week 3:
Bees are actively foraging on pollen and sugar syrup. Pollen scattered all over white paper.
Video below shows bees foraging on 10 ppb imidacloprid.
Above 10 ppb imidacloprid, week 4:
Bees are sluggish and spend more time sitting. Some pollen on white paper.
Video below shows bees foraging on 20 ppb imidacloprid.
Above 20 ppb imidacloprid, week 3:
Bees are sluggish and spend more time sitting. Very little pollen scattered on white paper. Data below videos show at 20 ppb compared to 0 ppb, bees move less.
20 ppb Statistics
20 ppb imidacloprid cause bees to sit for longer time compared to controls.
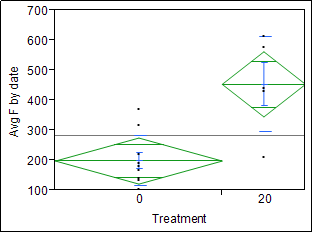
Cages were provided with 0 ppb (control) imidacloprid in sugar syrup (SS) or 20 ppb imidacloprid in SS. Bumble bees in control treatments sat for less time, while in 20 ppb imidacloprid treatments bumble bees sat for significantly longer times.
| Source | DF | F Ratio | Prob > F |
|---|---|---|---|
| Treatment | 1 | 17.2412 | 0.0011 |
| Error | 13 | ||
| C. Total | 14 |
| Level | Number | Mean | Std. Dev. | Std. Err. |
|---|---|---|---|---|
| 0 | 10 | 198.620 | 83.568 | 26.426 |
| 20 | 5 | 454.236 | 159.193 | 71.193 |
Video below shows bees foraging on 100 ppb imidacloprid.
Above 100 ppb imidacloprid, week 3:
Bees do not move and spend more time sitting. Very little pollen scattered on white paper. Data below videos show at 100 ppb compared to 0 ppb, bees move less.
100 ppb Statistics
100 ppb imidacloprid caused bees to sit for longer time compared to controls.
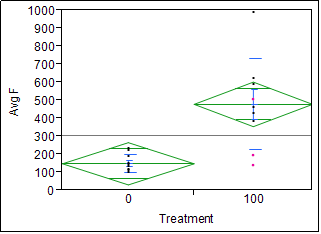
Cages were provided with 0 ppb (control) imidacloprid in sugar syrup (SS) or 100 ppb imidacloprid in SS. Bumble bees in control treatments sat for less time, while in 100 ppb imidacloprid treatments bumble bees sat for significantly longer times.
| Source | DF | F Ration | Prob > F |
|---|---|---|---|
| Treatment | 1 | 16.6547 | 0.0008 |
| Error | 17 | ||
| C. Total | 18 |
| Level | Number | Mean | Std. Dev. | Std. Err. |
|---|---|---|---|---|
| 0 | 10 | 149.173 | 48.477 | 15.330 |
| 100 | 9 | 479.282 | 251.430 | 83.810 |